【Survey】Maxout Networks

Maxout Networks

pdf

Ian J. Goodfellow, David Warde-Farley, Mehdi Mirza, Aaron Courville, Yoshua Bengio

Abstract

  • モデルの汎化のためのdropoutというテクニックがある.
  • 我々はdropoutに加えるテクニックとして, maxout というシンプルなモデルを考案した
    • 入力のセットのうち最大なものを出力するためこのように命名
  • 目的は2つ
    • dropoutによる最適化を促進すること
    • dropoutの高速なapproximate model averaging techniqueの正確性を向上すること
    • 実験により上記を達成したことを確認した
      • MNIST, CIFAR-10, CIFAR-100, SVHN

Introduction

  • Hinton et al.のdropoutは,安価で簡易なアンサンブルなモデルの訓練手法だ
    • パラメータを共有し,モデルの予測を平均化する
    • しかしdeep architectureにはこれまで試されてこなかった

  • dropoutのための理想的なoperating regimeは.パラメータ更新が大きく行われる際だ.パラメータ共有の制約下でアンサンブル学習すること
  • これはstochastic gradientのregimeと全く異なる
    • 1つのモデルが小さいステップで進行していく

  • 別の懸念として,deep modelsでは,dropout model averagingはただのapproximation(近似)にすぎないことである
    • この近似誤差を小さくすることは,dropoutのパフォーマンスを良くすることにつながる

  • maxout を提案する
    • 最適化と,dropoutを使ったmodel averagingに有効な特徴がある

Review of dropout

  • output y
  • input vector v
  • series of hidden layers {{h = {{h^{(1)},..., h^{(L)}}}}}

  • dropoutはアンサンブルなモデルをtrainする
    • それぞれ,{v}{h}のサブセットをもっている

  • 同じ {\theta}{p(y|v;\theta,\mu)} に対して使う
    • {\mu \in M}バイナリマスク.それはどの変数をモデルに含むかを決める

  • Droput trainingはbagging(Breiman, 1994)に近い
    • 違う多くのモデルが,異なる入力に対して訓練する
  • dropoutは次の点でbaggingと異なる
    • 1stepだけ訓練し,パラメータは全モデルで共有する点

  • functional formは,全サブモデルの予測をアンサンブルするときに重要となってくる
    • どう平均するか?
    • 幸運なことに,幾何平均を算出するのは簡単
    • {W/2} をすればよい...(なぜ)

3. Description of maxout

{ x \in \mathbb{R}^d} を入力とするとき, maxout hidden layerは以下の関数をとる.

$$ h_{i}(x) = \max_{j \in [1,k]} z_{ij} $$

ただし {z_{ij} = x^{T} W_{...ij} + b_{ij}}であり, {W \in \mathbb{R}^{d×m×k}}{b \in \mathbb{R}^{m×k}} は学習パラメータとする.

  • maxoutはこれまでのactivation functionとは異なる特徴を持つ
    • maxoutによる表現は密である
    • localにはlinearである.
  • これらを考えるとうまくいくとは思えないのだが,実際にはロバストで学習しやすく,驚異的なパフォーマンスを示す.

4. Maxout is a universal approximator

  • standardなMLPはuniversal approximatorであるように, maxoutもuniversal approximatorだ

7. Model averaging

  • 効果的なモデルであることは実験でわかった

次に読みたい論文

  • dropout論文(Hinton el al.,2012)

【CS231n】Convolutional Neural Networks: Architectures, Convolution / Pooling Layers

Stanford大の教材CS231nを使ってNNやCNNを学んでいる.
この記事では、CNNの概要を学ぶ。

CNNはこれまで学んできたNNとほとんど変わらない。
CNNの特徴は、入力データがほぼ決まって画像であることである。
画像の性質を使ったエンコードを用いて特徴量を抽出していく。

Architecture Overview

普通のNNはスケールしないので画像に向かない
  • CIFAR-10データセットだと画像サイズは[32 * 32 * 3]なので、
    はじめのNeural Networkは32323=3072の重みパラメータをもつ。
    • これ以上大きくできない
    • [200 * 200 * 3]の画像だと、120,000のパラメータ数になる
3次元ニューロン
f:id:yusuke_ujitoko:20170116221646p:plain (CS231nより引用)

Layers used to build ConvNets

  • ConvNetを構成する3種類のレイヤー
    • Convolutional Layer
    • Pooling Layer
    • Fully-Connected Layer
  • これらを組み合わせてConvNet architectureをつくる
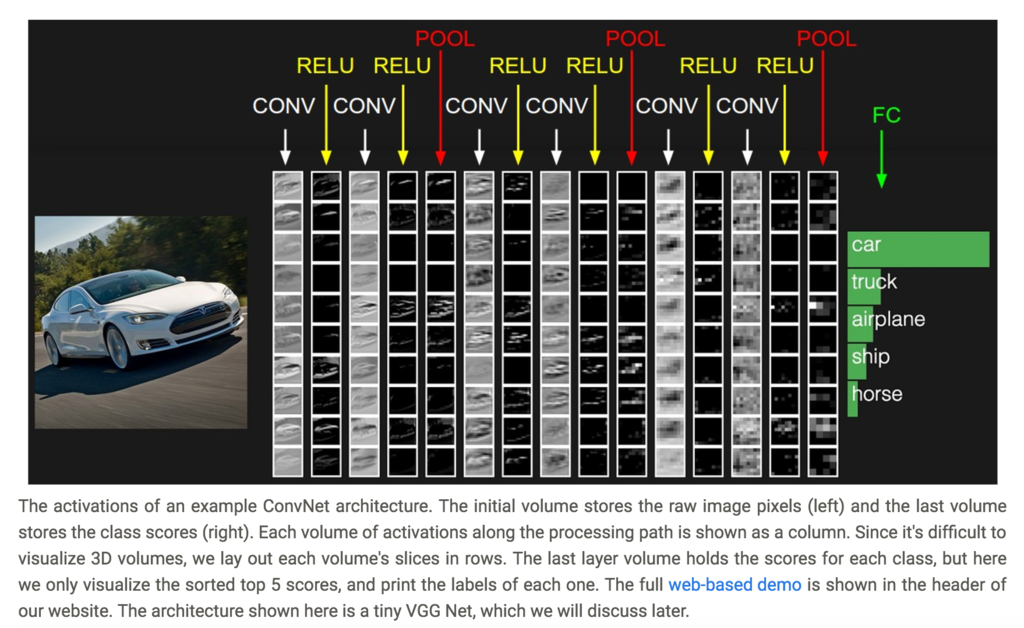
  • CIFAR-10用のConvNetは[INPUT - CONV- RELU - POOL - FC]からなる
  • INPUT [32 * 32 * 3]
    • 生データ
  • CONV layer
    • 重みと入力の畳み込みを演算する
    • 出力は、12個のフィルタを使うとき[32 * 32 * 12]となる
  • RELU layer
    • 要素ごとに{\max(0,x)}を計算する
    • 出力サイズは変わらず[32 * 32 * 12]
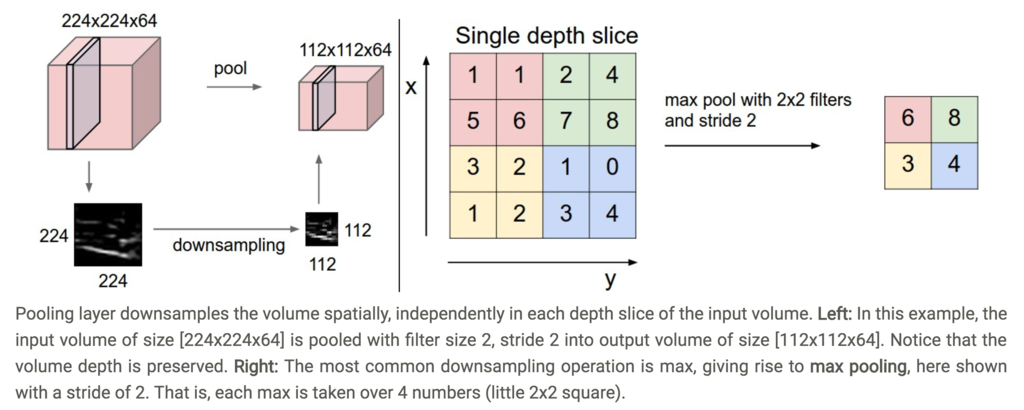
  • POOL layer
    • downsampling operation
    • 出力サイズは[16 * 16 * 12]
  • FC(fully-connected) layer
    • クラスのスコアを計算する
    • 出力サイズは[1 * 1 * 10]
f:id:yusuke_ujitoko:20170116225713p:plain (CS231nより引用)

以降は、それぞれのレイヤについて詳細にみていく

ConvNet Layers

脳やニューロンのアナロジーなしで議論してみる
  • CONV layerのパラメータ群は学習可能なフィルタからなる
  • 各フィルタは空間性をもつ(depthだけ最大となっている)
    • [5 * 5 * 3]のサイズのConvNet
    • forward passでは、端から端へフィルタをslideさせて、入力との内積をとり、2次元のデータ(activation map)を得る
    • 12個のフィルタがあるときには、それぞれ2次元のactivation mapを得る。
脳とみなして議論してみる
  • 3次元の出力は、左右のニューロンと共通のパラメータを持つものと解釈できる。
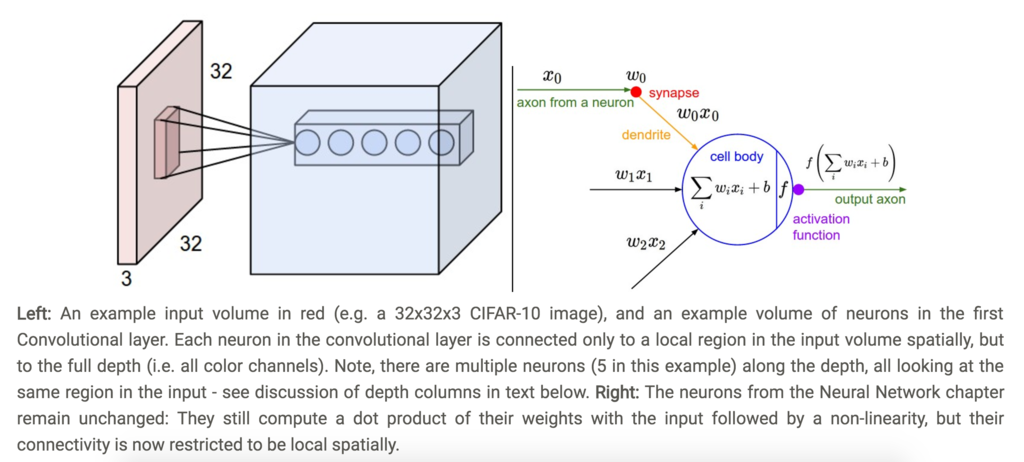
局所的な結合性(Local Connectivity)
  • 画像のような巨大な入力のときには、全ニューロンが全ニューロンと結合するのは実際的ではない
  • その代わりに局所的に結合し合う
例1
  • [32 * 32 * 3]のサイズの入力のとき
    • receptive fieldが[5 * 5]とすると、ConvLayerは[5 * 5 * 3]の重みをもつ。

例2
  • [16 * 16 * 20]のサイズの入力のとき
    • receptive fieldが[3 * 3]とすると、ConvLayerは[3 * 3 * 20]の重みをもつ。
f:id:yusuke_ujitoko:20170117211338p:plain (CS231nより引用)
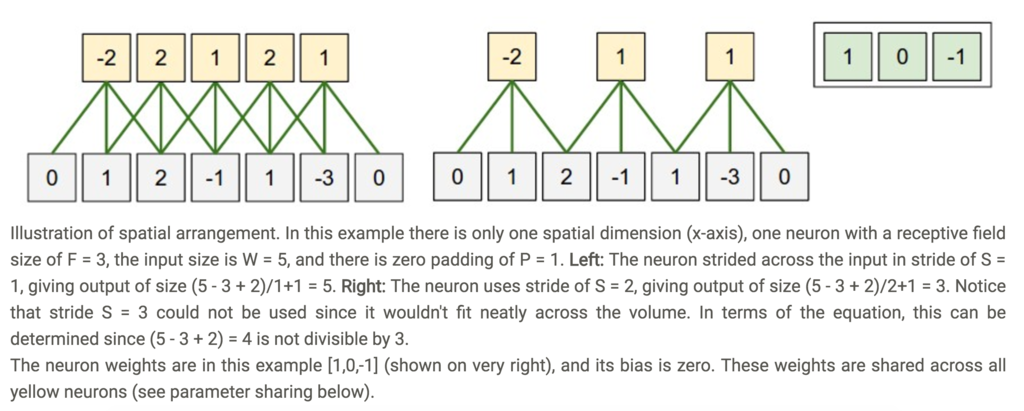
Spatial arrangement
  • 出力サイズを決めるハイパーパラメータは3つある
    • depth
    • stride
    • zero-padding

  • depth
    • 使いたいフィルタの数を示す
  • stride
    • フィルタをスライドする幅をきめる
  • zero-padding
    • 境界の周りに0を詰めることで、出力サイズを入力サイズに保てる。

  • 出力サイズを入力サイズ{W}、receptive field size{F}、stride{S}、zero-paddingの幅{P}を使って計算できる
    • {(W-F+2P)/S + 1}
f:id:yusuke_ujitoko:20170117212556p:plain (CS231nより引用)
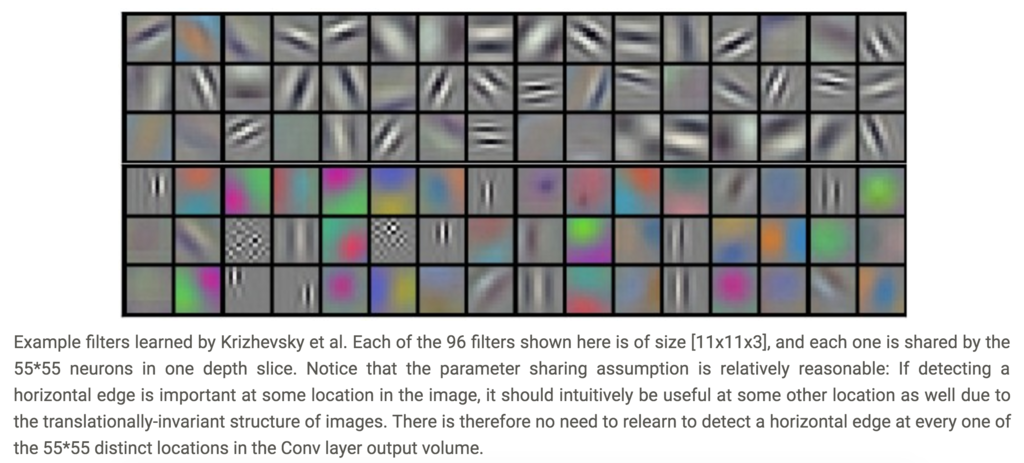
Parameter sharing
  • depth sliceした二次元上のニューロンは同じ重みとバイアスを持たせる。
    • これにより、パラメータの爆発を防げる。
    • これが畳み込みと言われる所以であり、そのときの重みはfilterと呼ばれる
f:id:yusuke_ujitoko:20170117222227p:plain (CS231nより引用)
  • ただし、ときにはparameter sharingは上手く行かないことがある
    • たとえば、入力データが中央に寄っている場合
      (顔など)
行列積として実装する
  • im2colという操作がある
    • これはフィルタ(重み)にとって都合の良いように入力データを展開する関数
      • たとえば、[2272273]の入力データが、[11113]のフィルタで畳み込み演算されるとき、
      • 入力データのうち[11113]分のブロック部分を、ベクトルに展開する。
      • この操作を畳み込み積分だけ行う(227-11)/4+1=55回
    • 同じようにフィルタもベクトルに展開する
  • こうして入力データと重みのベクトルをそれぞれ行列として作る。
  • あとは行列積を行う

  • この手法はメモリサイズで不利だが、それ以上に計算はBLASなどを使えば高速に行える。
backpropagation
  • ConvNetのbackpropはそのままでよい?
Dilated convolution
  • Fisher Yu and Vladlen Koltunの論文で、dilationと呼ばれるCONV layerのハイパーパラメータが紹介されている
    • フィルタサイズ3のフィルタを入力に適用する
      • dilation of 0のときw[0]x[0] + w[1]x[1] + w[2]*x[2]
      • dilation of 1のときw[0]x[0] + w[1]x[2] + w[2]*x[4]
  • スケールが異なる受容野を効率的に扱える。

Pooling Layer

  • Conv layersの中にPooling layerを挿入するのは一般的
  • 目的
    • パラメータの空間サイズを減らす
    • 過学習を制御すること

General pooling
  • max pooling以外にも、average poolingがあるが近年max poolingの方が使われつつある
f:id:yusuke_ujitoko:20170117231227p:plain (CS231nより引用)
pooling layerを取り除く
  • 多くの人がpooling operationを嫌って、取り除こうとしている.
  • たとえば、
  • パラメータ削減するために、CONV layerで使うstrideを大きくすることを提案している

Normalization Layer

Converting FC layers to CONV layers

  • 互いに変換可能

ConvNet Architectures

Layer Patterns

  • 一般的なConvNetの構造
    • CONV-RELU layersがあり、その後でPOOL layersがある。
    • これを繰り返し、画像が小さくする
    • ある所まで来たら、全結合層へ移行する。

INPUT -> [[CONV -> RELU]N -> POOL?]M -> [FC -> RELU]*K -> FC

  • 小さいフィルタのCONVを繰り返すほうが、大きいフィルタのCONV1つを使うよりも有利
    • CONVを繰り返すことで非線形性を表現できる
    • 同じサイズの出力を得る場合にも、パラメータが小さくて済む  

      Layer Sizing Patterns

Case studies

  • 名前の付いたCNNが色々ある。

  • LeNet
    • 1990年代に発表された。
      LeNet
  • AlexNet
    • 2012年にImageNet ILSVRC challengeで驚異的な成績を残して有名になった.
    • LeNetに似ているが、より深く大きくなったもの
  • ZF Net
    • ILSVRC 2013の勝者
    • ZFNet
  • GoogLeNet
    • ILSVRC 2014の勝者
    • Inception Module
  • VGGNet
  • ResNet
    • ILSVRC 2015の勝者
    • Residual Network

Computational Considerations

理解できなかった内容

Moreover, we would almost certainly want to have several such neurons, so the parameters would add up quickly! Clearly, this full connectivity is wasteful and the huge number of parameters would quickly lead to overfitting.

The brain view. If you’re a fan of the brain/neuron analogies, every entry in the 3D output volume can also be interpreted as an output of a neuron that looks at only a small region in the input and shares parameters with all neurons to the left and right spatially (since these numbers all result from applying the same filter). We now discuss the details of the neuron connectivities, their arrangement in space, and their parameter sharing scheme.

Backpropagation. The backward pass for a convolution operation (for both the data and the weights) is also a convolution (but with spatially-flipped filters). This is easy to derive in the 1-dimensional case with a toy example (not expanded on for now). 1x1 convolution. As an aside, several papers use 1x1 convolutions, as first investigated by Network in Network. Some people are at first confused to see 1x1 convolutions especially when they come from signal processing background. Normally signals are 2-dimensional so 1x1 convolutions do not make sense (it’s just pointwise scaling). However, in ConvNets this is not the case because one must remember that we operate over 3-dimensional volumes, and that the filters always extend through the full depth of the input volume. For example, if the input is [32x32x3] then doing 1x1 convolutions would effectively be doing 3-dimensional dot products (since the input depth is 3 channels).

まとめ

yusuke-ujitoko.hatenablog.com

非線形領域をlinear classifierと2層Neural Networkで分類してみる

3種のラベルのうち1種が付与されている点列データを、
linear classifierと2層NNでそれぞれ分類させてみる。

Stanfordのオンライン教材CS231n Convolutional Neural Networks for Visual Recognitionを参考にしている。

Linear Classifier

入力データとパラメータ

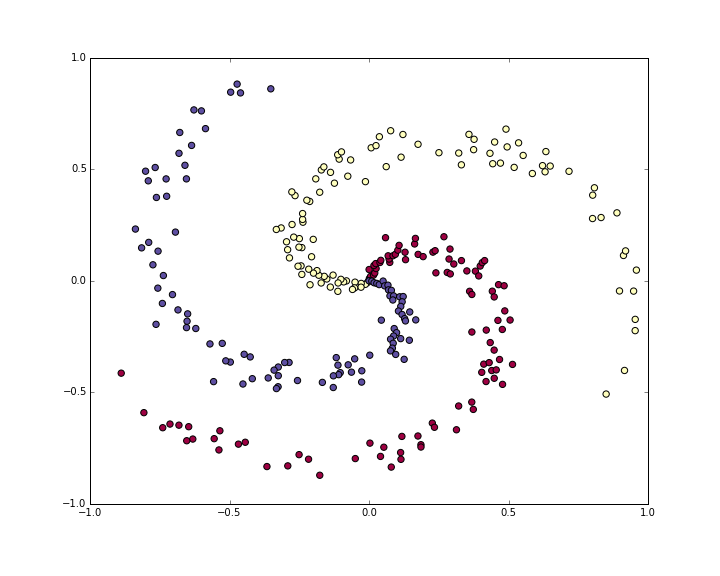
非線形な領域をつくるように点群を作成 1種ごとに100点の訓練データがある。

f:id:yusuke_ujitoko:20170115185022p:plain

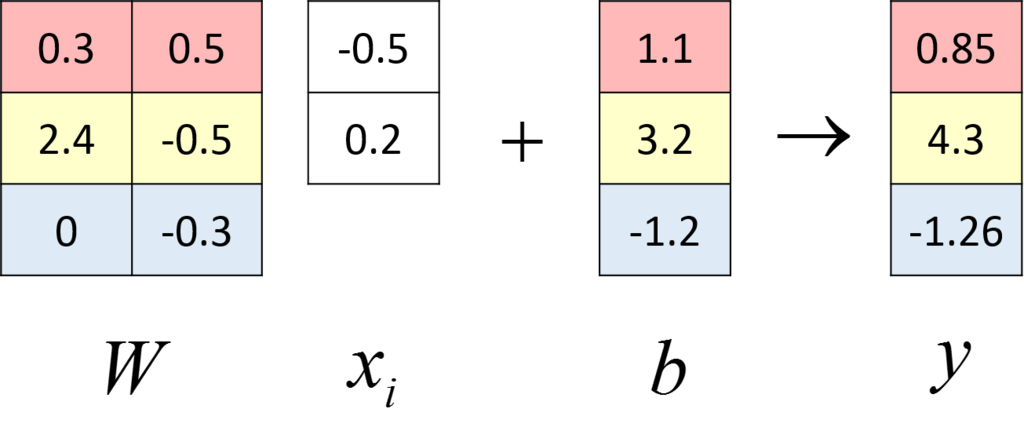
入力データに対して、重み{W}バイアス{b}を施し、

f:id:yusuke_ujitoko:20170116214140p:plain:w500

Softmax関数を出力とした。
Softmax関数なので、交差エントロピー誤差を最小にするようなパラメータをSGDで求めた。

分類結果

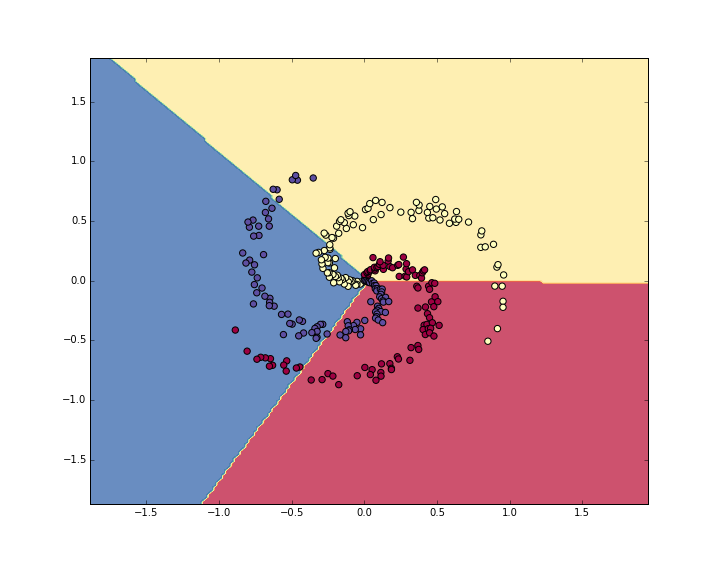
training dataに対して、正しく分類できたかを評価すると56%という結果となった。
(test dataを分けて作っていなことに注意)
下図でそれが一目瞭然だ。

下図の背景の色は、linear classifierで領域全体を3種に分類した結果領域を示しており、
点群は入力データで、その色は種類を指している。

背景と点の色が一致していれば、分類成功であり、
不一致であれば、上手くいっていないことを示している。

当然ながら、Linear Classifierの名の通り、
領域を線形分類しているため、非線形な入力データには対応できていない。 f:id:yusuke_ujitoko:20170115185345p:plain

2層NeuralNetwork

基本的な方針はLinear Classifierのときと同じ。
層が増えるのでforward passとbackpropagationの計算が倍になる。

入力データ

f:id:yusuke_ujitoko:20170115212625p:plain

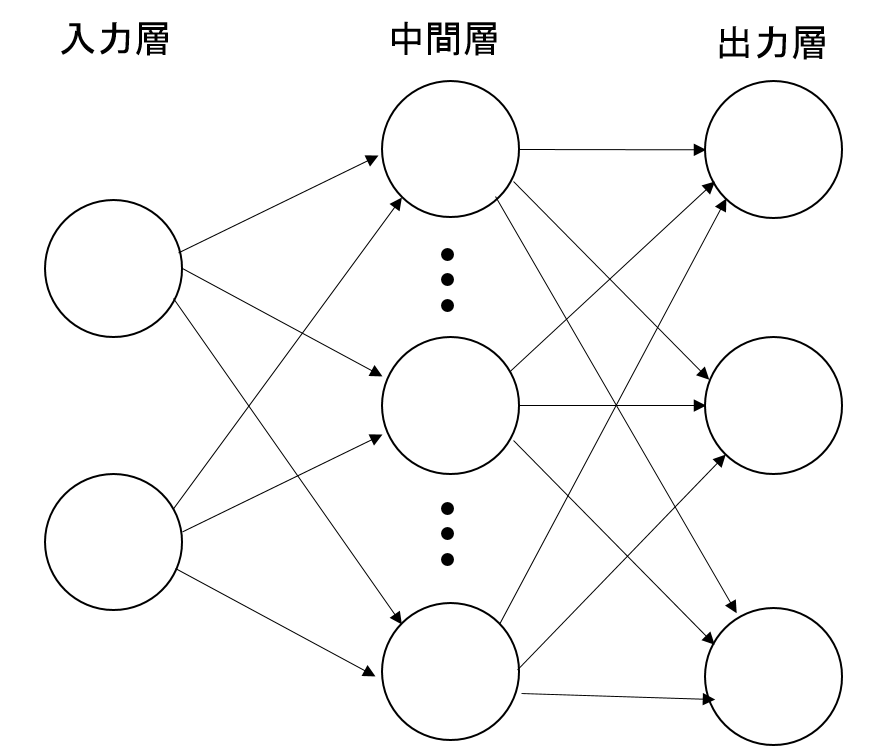
ネットワークの構成

f:id:yusuke_ujitoko:20170122000700p:plain:w500

注意点としては、

  • regularization lossの計算で、二層分の重みを加えること
  • forward passでReLU関数で値を0にされた項は、backpropのときに勾配を0にすること

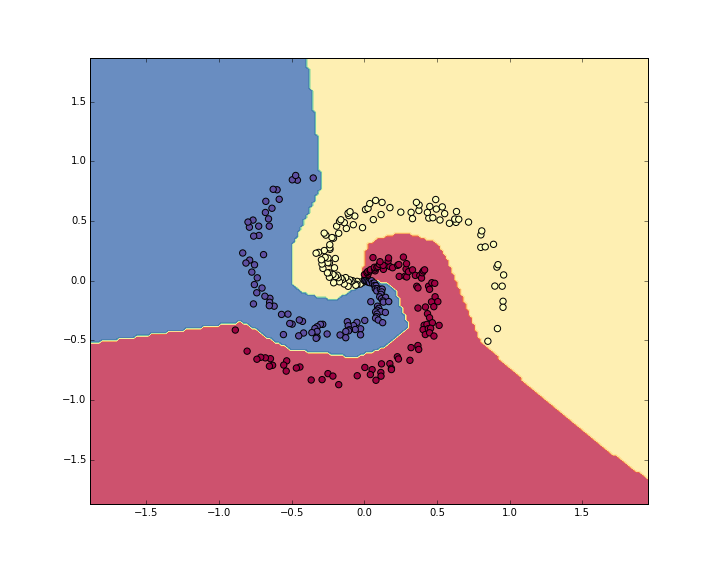
分類結果

training dataに対して、正しく分類できたかの評価は100%となった。 f:id:yusuke_ujitoko:20170115220515p:plain

分類領域の変化

NNを学習させる過程で、領域がぐにょぐにょ動く様子は面白い。 f:id:yusuke_ujitoko:20170115212906g:plainyoutube:https://www.youtube.com/watch?v=yGihMqZZ13w&feature=youtu.be

Loss functionの推移

f:id:yusuke_ujitoko:20170115212615p:plain

Accuracyの推移

f:id:yusuke_ujitoko:20170115212608p:plain

Stanfordの授業CS231nでニューラルネット、畳み込みニューラルネットを学ぶ

StanfordのCS231nという授業の教材を使って、機械学習を学んだ。
自分のメモのまとめ。
(写経に近いので注意)

Module 1: Neural Networks

Module 2: Convolutional Neural Networks(更新予定)

【CS231n】Putting it together: Minimal Neural Network Case Study

Stanford大の教材CS231nを使ってNNやCNNを学んでいる.
この記事では、toy Neural Networkを実装する。
最初にシンプルなlinear classifierを作り、その次に2層NNへ拡張する

Generating some data

  • 簡単に線形分離できないdatasetを生成する
  • 例として渦状のデータとする
    • クラスごとに100点生成
N = 100 # number of points per class
D = 2 # dimensionality
K = 3 # number of classes
X = np.zeros((N*K,D)) # data matrix (each row = single example)
y = np.zeros(N*K, dtype='uint8') # class labels
for j in xrange(K):
  ix = range(N*j,N*(j+1))
  r = np.linspace(0.0,1,N) # radius
  t = np.linspace(j*4,(j+1)*4,N) + np.random.randn(N)*0.2 # theta
  X[ix] = np.c_[r*np.sin(t), r*np.cos(t)]
  y[ix] = j
# lets visualize the data:
plt.scatter(X[:, 0], X[:, 1], c=y, s=40, cmap=plt.cm.Spectral)
f:id:yusuke_ujitoko:20170111195434p:plain:w500 (CS231nより引用)

Training a Softmax Linear Classifier

Initialize the parameters

  • パラメータ生成と初期化
    • python D = 2は次元
    • python K = 3は分類クラスの数
# initialize parameters randomly
W = 0.01 * np.random.randn(D,K)
b = np.zeros((1,K))

Compute the class scores

  • linear classifierを作るので、行列-ベクトル積を計算する
# compute class scores for a linear classifier
scores = np.dot(X, W) + b

  • 2次元の300個の点なので、python scoresは[300 * 3]というサイズ
    • 各行はそれぞれのクラスの点を保持(blue, red, yellow)

Compute the loss

  • loss functionの計算
    • クラスごとのscoresがどのくらい満たされてないかを示す
  • ここではloss functionにsoftmaxのcross-entropy loss(交差エントロピー損失)を使う
    • {f}はクラスごとのscore、 {} $$ L_{i} = - \log \frac{e^{f_{y_{i}}}}{\sum_{j} e^{f_{j}}} $$

  • logの中身は、真のクラスの正規化された確率を示す

    • 真のクラスのscoreが小さければ、lossは無限になる
    • 逆に大きければ、0に近づく
  • 完全なSoftmax classifier loss は、cross-entropy lossの平均と、正規化項の和になる {} $$ L = \frac{1}{N} \sum_{i} L_{i} + \frac{1}{2} \sum_{k} \sum_{l} W_{k,l}^{2} $$

  • scoreをもとにlossを計算する
# get unnormalized probabilities
exp_scores = np.exp(scores)
# normalize them for each example
probs = exp_scores / np.sum(exp_scores, axis=1, keepdims=True)

  • クラス分類ごとに正規化する
corect_logprobs = -np.log(probs[range(num_examples),y])

  • 完全なlossは上記のlogをとって平均化したものに、正規化 lossを足したもの
# compute the loss: average cross-entropy loss and regularization
data_loss = np.sum(corect_logprobs)/num_examples
reg_loss = 0.5*reg*np.sum(W*W)
loss = data_loss + reg_loss

Computing the Analytic Gradient with Backpropagation

  • lossを最小化したい。そのためにgradient descentする
    • ランダムなパラメータから始め、
    • loss functionの勾配を評価し、
    • どうパラメータを移動すればよいか判断する

  • 中間変数[tex:{p}}を導入する
    • 確率を表現 {} $$ p_{k} = \frac{e^{f_{y_{i}}}}{\sum_{j} e^{f_{j}}} \ \ \ \ \ \ \ \ \ L_{i} = - \log (p_{y_{i}}) $$

  • {\partial L_{i} / \partial f_{k}} を求めたい
    • {L}{p}に依存しており、{p}{f}に依存している
    • 連鎖律を使って求めていく {} $$ \frac{\partial L_{i}}{\partial f_{k}} = p_{k} - 1(y_{i} = k) $$

  • スコアの勾配python dscoresを得る
dscores = probs
dscores[range(num_examples),y] -= 1
dscores /= num_examples

  • スコアの勾配から重み{W}{b}の勾配を算出していく
dW = np.dot(X.T, dscores)
db = np.sum(dscores, axis=0, keepdims=True)
dW += reg*W # don't forget the regularization gradient

Performing a parameter update

  • 勾配が減る方向に動かす
# perform a parameter update
W += -step_size * dW
b += -step_size * db

Putting it all together: Training a Softmax Classifier

  • 全てを一つにまとめる。
    これがsoftmax classifierの全体
#Train a Linear Classifier
# initialize parameters randomly
W = 0.01 * np.random.randn(D,K)
b = np.zeros((1,K))

# some hyperparameters
step_size = 1e-0
reg = 1e-3 # regularization strength

# gradient descent loop
num_examples = X.shape[0]
for i in xrange(200):
  
  # evaluate class scores, [N x K]
  scores = np.dot(X, W) + b 
  
  # compute the class probabilities
  exp_scores = np.exp(scores)
  probs = exp_scores / np.sum(exp_scores, axis=1, keepdims=True) # [N x K]
  
  # compute the loss: average cross-entropy loss and regularization
  corect_logprobs = -np.log(probs[range(num_examples),y])
  data_loss = np.sum(corect_logprobs)/num_examples
  reg_loss = 0.5*reg*np.sum(W*W)
  loss = data_loss + reg_loss
  if i % 10 == 0:
    print "iteration %d: loss %f" % (i, loss)
  
  # compute the gradient on scores
  dscores = probs
  dscores[range(num_examples),y] -= 1
  dscores /= num_examples
  
  # backpropate the gradient to the parameters (W,b)
  dW = np.dot(X.T, dscores)
  db = np.sum(dscores, axis=0, keepdims=True)
  
  dW += reg*W # regularization gradient
  
  # perform a parameter update
  W += -step_size * dW
  b += -step_size * db
  • これを実行すると以下の出力を得る
iteration 0: loss 1.096956
iteration 10: loss 0.917265
iteration 20: loss 0.851503
iteration 30: loss 0.822336
iteration 40: loss 0.807586
iteration 50: loss 0.799448
iteration 60: loss 0.794681
iteration 70: loss 0.791764
iteration 80: loss 0.789920
iteration 90: loss 0.788726
iteration 100: loss 0.787938
iteration 110: loss 0.787409
iteration 120: loss 0.787049
iteration 130: loss 0.786803
iteration 140: loss 0.786633
iteration 150: loss 0.786514
iteration 160: loss 0.786431
iteration 170: loss 0.786373
iteration 180: loss 0.786331
iteration 190: loss 0.786302

  • 190回の反復で収束する
  • このtraining setを評価する
# evaluate training set accuracy
scores = np.dot(X, W) + b
predicted_class = np.argmax(scores, axis=1)
print 'training accuracy: %.2f' % (np.mean(predicted_class == y))

  • 49%を得る。 そこまで良くはない。
f:id:yusuke_ujitoko:20170111211313p:plain (CS231nより引用)

  • 無理やり線形分離している…

Training a Neural Network

  • NNで同じ課題に取り組んでみる

  • 隠れ層が必要なので、その分重みとバイアスを用意
# initialize parameters randomly
h = 100 # size of hidden layer
W = 0.01 * np.random.randn(D,h)
b = np.zeros((1,h))
W2 = 0.01 * np.random.randn(h,K)
b2 = np.zeros((1,K))
  • scoreを計算するforward passも2層分
# evaluate class scores with a 2-layer Neural Network
hidden_layer = np.maximum(0, np.dot(X, W) + b) # note, ReLU activation
scores = np.dot(hidden_layer, W2) + b2
  • 2層目のパラメータの勾配を計算
# backpropate the gradient to the parameters
# first backprop into parameters W2 and b2
dW2 = np.dot(hidden_layer.T, dscores)
db2 = np.sum(dscores, axis=0, keepdims=True)
  • 1層目のパラメータの勾配を計算するために、逆伝播していく
dhidden = np.dot(dscores, W2.T)
  • ReLU関数をbackprop
# backprop the ReLU non-linearity
dhidden[hidden_layer <= 0] = 0
  • 1層目のパラメータの勾配を計算
# finally into W,b
dW = np.dot(X.T, dhidden)
db = np.sum(dhidden, axis=0, keepdims=True)
  • パラメータの更新は変更なし
  • 以下が完全なコード
# initialize parameters randomly
h = 100 # size of hidden layer
W = 0.01 * np.random.randn(D,h)
b = np.zeros((1,h))
W2 = 0.01 * np.random.randn(h,K)
b2 = np.zeros((1,K))

# some hyperparameters
step_size = 1e-0
reg = 1e-3 # regularization strength

# gradient descent loop
num_examples = X.shape[0]
for i in xrange(10000):
  
  # evaluate class scores, [N x K]
  hidden_layer = np.maximum(0, np.dot(X, W) + b) # note, ReLU activation
  scores = np.dot(hidden_layer, W2) + b2
  
  # compute the class probabilities
  exp_scores = np.exp(scores)
  probs = exp_scores / np.sum(exp_scores, axis=1, keepdims=True) # [N x K]
  
  # compute the loss: average cross-entropy loss and regularization
  corect_logprobs = -np.log(probs[range(num_examples),y])
  data_loss = np.sum(corect_logprobs)/num_examples
  reg_loss = 0.5*reg*np.sum(W*W) + 0.5*reg*np.sum(W2*W2)
  loss = data_loss + reg_loss
  if i % 1000 == 0:
    print "iteration %d: loss %f" % (i, loss)
  
  # compute the gradient on scores
  dscores = probs
  dscores[range(num_examples),y] -= 1
  dscores /= num_examples
  
  # backpropate the gradient to the parameters
  # first backprop into parameters W2 and b2
  dW2 = np.dot(hidden_layer.T, dscores)
  db2 = np.sum(dscores, axis=0, keepdims=True)
  # next backprop into hidden layer
  dhidden = np.dot(dscores, W2.T)
  # backprop the ReLU non-linearity
  dhidden[hidden_layer <= 0] = 0
  # finally into W,b
  dW = np.dot(X.T, dhidden)
  db = np.sum(dhidden, axis=0, keepdims=True)
  
  # add regularization gradient contribution
  dW2 += reg * W2
  dW += reg * W
  
  # perform a parameter update
  W += -step_size * dW
  b += -step_size * db
  W2 += -step_size * dW2
  b2 += -step_size * db2
  • これを実行すると以下の出力を得る
iteration 0: loss 1.098744
iteration 1000: loss 0.294946
iteration 2000: loss 0.259301
iteration 3000: loss 0.248310
iteration 4000: loss 0.246170
iteration 5000: loss 0.245649
iteration 6000: loss 0.245491
iteration 7000: loss 0.245400
iteration 8000: loss 0.245335
iteration 9000: loss 0.245292
  • training accuercyは98%
# evaluate training set accuracy
hidden_layer = np.maximum(0, np.dot(X, W) + b)
scores = np.dot(hidden_layer, W2) + b2
predicted_class = np.argmax(scores, axis=1)
print 'training accuracy: %.2f' % (np.mean(predicted_class == y))
f:id:yusuke_ujitoko:20170111213725p:plain:w500 (CS231nより引用)

Summary

  • toy 2Dデータセットを使って、linear networkと2層NNをtraining
  • コード的には、小さな差しかない
    • score function
    • backpropagation
  • 結果をみると歴然たる違いがあった
まとめ

yusuke-ujitoko.hatenablog.com